If you run services in AWS, Azure or GCP, the difference between a smooth quarter and a painful one often comes down to the few metrics you choose to obsess over. Cloud service management has hundreds of available measures, yet only a small set truly moves reliability, speed, cost and security in the right direction. This article distils the KPIs that matter in 2025, how to define them precisely, where to source the data, and how to turn them into a scorecard executives and engineers both trust.
What cloud service management means in 2025
Cloud service management spans everything required to operate customer facing and internal platforms effectively. It includes SLO driven reliability, incident response, CI and CD, infrastructure as code, observability, FinOps, and security operations. Environments are hybrid by default, with Kubernetes, serverless and managed databases living alongside SaaS dependencies. Your KPIs must therefore measure outcomes across this whole surface, not just machine level metrics or ticket volumes.
Two principles underpin an effective KPI set. First, measure from the user’s point of view where possible, for example request success and latency percentiles at the service boundary. Second, balance lagging and leading indicators. MTTR is lagging, deployment frequency and error budget burn rate are leading. Both are needed to steer day to day choices.
The KPIs that matter
Below are the core KPIs we see high performing teams using. Each has a crisp definition so it can be automated and audited.
Reliability and customer experience
Availability SLO compliance. Define an SLO that reflects real user success, for example successful requests divided by total requests over a calendar window. Express compliance as the percentage of time the service met the SLO in the period. Pair this with an error budget, the allowed unreliability that enables safe change.
Latency, p95 and p99. Report latency at the 95th and 99th percentiles for the critical user journeys, not averages. Percentiles catch long tail performance that breaks experience for real users.
Error budget burn rate. Measure how fast you consume the remaining error budget over short and long windows, for example one hour and one day, and page when burn rate would exhaust the budget before the period ends. This prevents slow motion reliability regressions.
Mean time to detect and restore, MTTD and MTTR. Track the minutes from first customer impact to detection, then to full restoration. MTTR is a staple for a reason, it reflects operational readiness, quality of runbooks and depth of observability.
Change and delivery performance
Deployment frequency. Count production deployments per service per day or week. Healthy teams deploy smaller changes more often, which reduces risk.
Lead time for changes. Measure the time from code committed to running in production. Shorter lead times correlate with faster learning and lower change risk.
Change failure rate. Define as the percentage of production changes that require rollback, a hotfix or cause an incident. This encourages quality without discouraging frequent delivery. The DORA research popularised this measure alongside deployment frequency, MTTR and lead time.
Cost and efficiency, FinOps
Cost per business unit of value. Choose a driver that leaders care about, for example per thousand requests, per active customer, per order or per GB processed. Divide total cloud spend attributed to the service by that driver in the same period. This is your unit cost and it anchors conversations in economics, not invoices.
Cost allocation coverage. The percentage of spend correctly tagged or assigned to a product or owner. Without 90 percent plus allocation you cannot manage cost with intent.
Waste spend percentage. The share of spend on idle or over provisioned resources. Think stopped yet billable disks, underutilised instances, orphaned load balancers, unattached IPs or snapshots with no retention policy. Waste trending down indicates a healthy cost practice.
Commitment coverage. The proportion of eligible compute covered by Savings Plans or reserved capacity. Combined with right sizing, this shows maturity in cost optimisation. The FinOps Framework provides useful guidance on these measures.
Security and compliance
Vulnerability MTTR. Mean time to remediate critical and high vulnerabilities from detection to fix in production. Track against policy windows, for example seven days for critical, thirty for high.
Patch latency. Time from a vendor releasing a critical patch to it being applied in production for covered assets. This is different from vulnerability MTTR and is often owned by a different team.
Configuration compliance rate. Percentage of cloud resources meeting mandatory policies, for example encryption at rest, TLS in transit, MFA for privileged accounts, least privilege on IAM roles. Non compliant resources should trigger work items, not just alerts.
Platform and architecture health
Resource saturation. CPU, memory and storage saturation measured as p95 utilisation per service, plus queue depth and worker backlog. Saturation close to 100 percent where autoscaling does not react quickly enough is a leading indicator of latency and timeout incidents.
Automation and toil ratio. Time spent on repetitive, manual tasks divided by total operations time. Driving toil down through automation correlates with improved reliability and happier teams.
Infrastructure drift rate. Percentage of resources that differ from the infrastructure as code source of truth. Drift erodes reproducibility and compliance.
Backup and restore success. Backup job success rate and tested restore time compared to RPO and RTO. Untested backups are not backups.
Service management effectiveness
Time to acknowledge. Median time for an on call engineer to acknowledge a page. Slow acknowledgement usually means poor alert routing, lack of 24 by 7 coverage or notification issues.
First contact resolution rate. Percentage of tickets resolved without escalation. This measures knowledge management quality and the effectiveness of front line teams.
Backlog age. Percentage of open tickets older than your policy threshold. It highlights systemic under resourcing or broken processes.
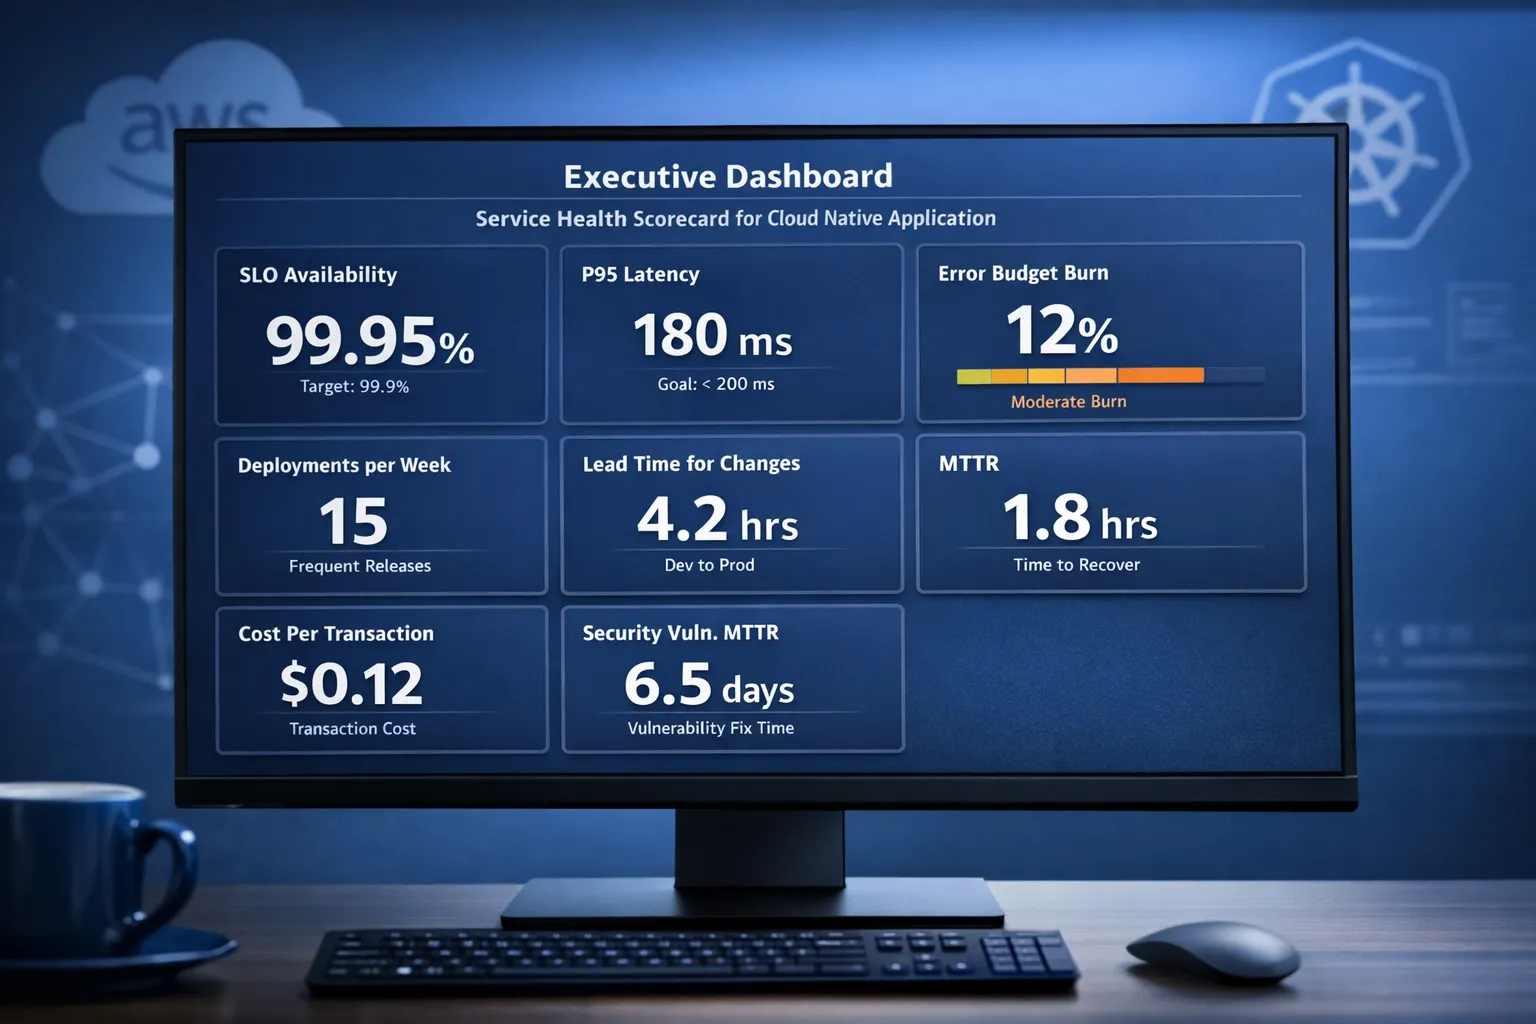
A practical KPI scorecard
Here is a compact scorecard you can adopt and adapt. Targets are indicative, set them by business criticality and historical baselines.
| KPI | Definition | Formula | Typical target | Primary data source | Notes |
|---|---|---|---|---|---|
| SLO availability compliance | Percentage of time the service meets its availability SLO | Successful requests divided by total requests over window | 99.9 to 99.99 percent monthly by tier | App gateway or API metrics, APM, synthetic checks | Define success precisely, for example HTTP 2xx and 3xx only |
| p95 latency | 95th percentile latency for a key user journey | p95 of end to end latency | Service specific, set per journey | APM, RUM, synthetic | Track p99 for critical transactions |
| Error budget burn rate | Rate of error budget consumption over fast and slow windows | Consumed budget divided by remaining time | Stay below alert thresholds | SLO tooling, APM | Use two windows to catch fast and slow burns |
| MTTR | Mean time to restore service after customer impact | Sum of restoration times divided by incident count | Policy driven, often under 60 minutes for tier 1 | Incident system, status pages | Split by severity for clarity |
| Deployment frequency | How often production changes are shipped | Count per service per period | Daily or higher for most web services | CI or CD system | Pair with change failure rate |
| Lead time for changes | Time from commit to production | Deploy time minus commit time | Under one day for small changes | VCS and CD | Segment by service |
| Change failure rate | Percentage of changes causing incidents or rollbacks | Failed changes divided by total changes | Under 10 percent | CI or CD and incident system | Align definition across teams |
| Cost per transaction, unit cost | Cloud cost normalised by a business driver | Allocated cost divided by business volume | Trending down or stable at target | Cost platform and product analytics | Choose one primary unit per service |
| Cost allocation coverage | Share of spend with owner or tag | Allocated spend divided by total spend | Over 90 percent | Cloud billing and tagging | Enforce with policies and pipelines |
| Waste spend percentage | Share of spend on idle or over provisioned resources | Waste divided by total cost | Under 10 percent | Cost and utilisation metrics | Includes idle disks, unattached IPs, zombie workloads |
| Vulnerability MTTR | Mean time to remediate critical and high vulns | Sum of remediation times divided by count | Within policy windows, for example 7 and 30 days | Security scanners and CMDB | Track by environment and asset class |
| Infrastructure drift rate | Share of resources not matching IaC | Drifted resources divided by total resources | Near zero | IaC drift tools, policy as code | Drift should open work items automatically |
If you need a deeper dive into measuring reliability at scale, the Google SRE workbook remains a definitive reference for SLI and SLO design.
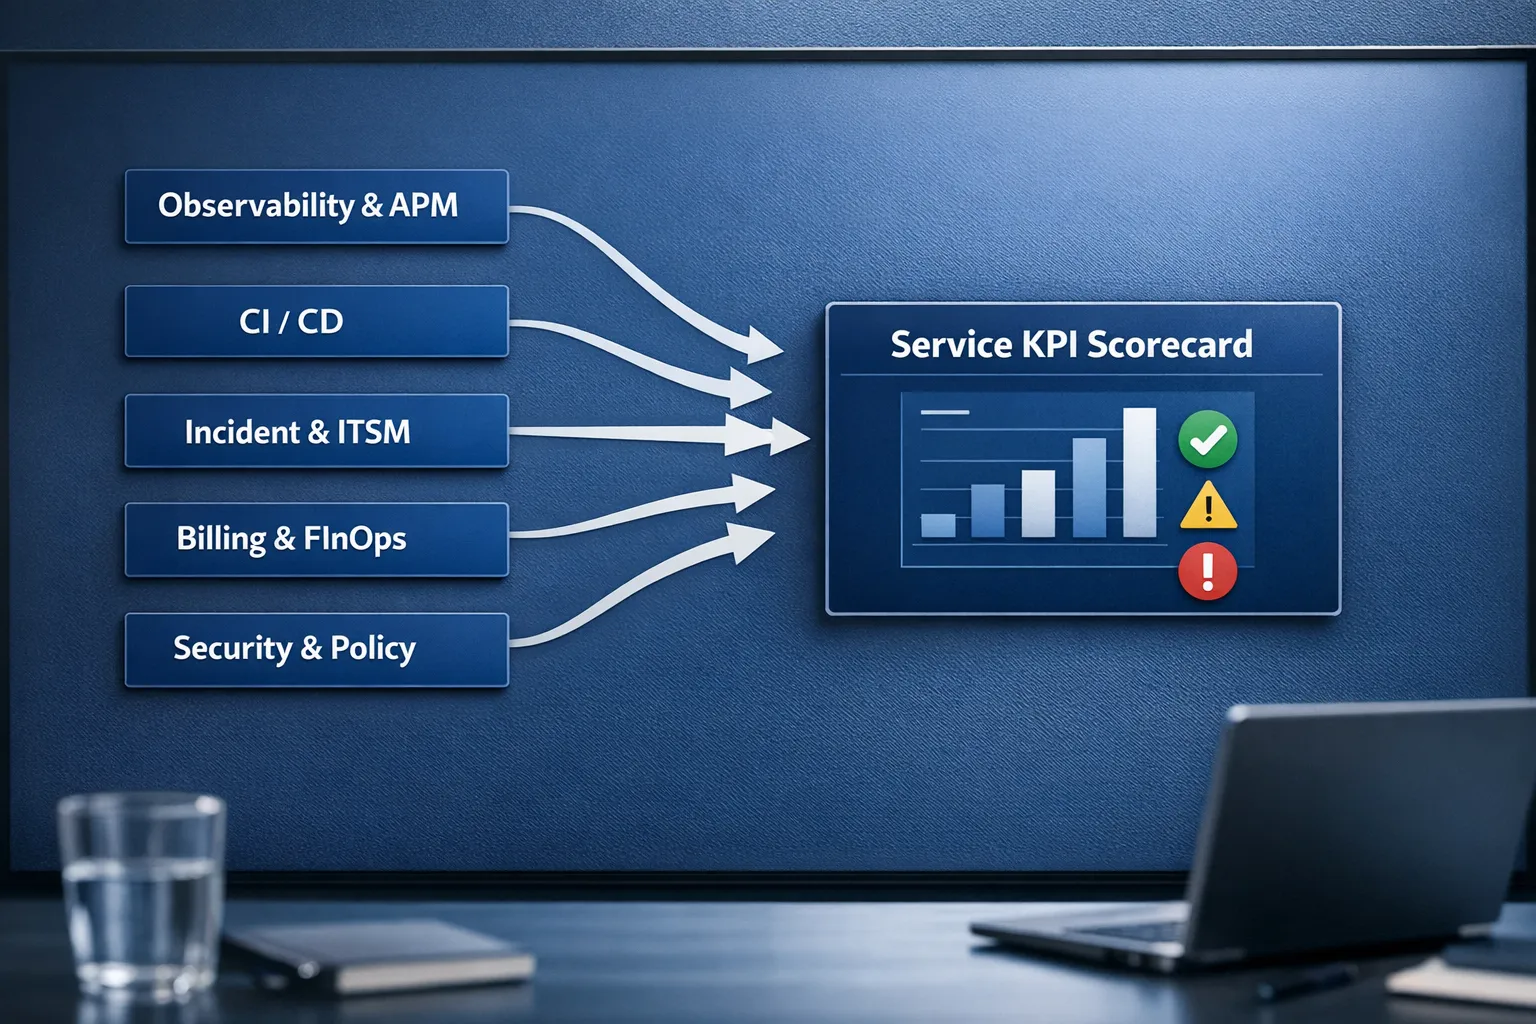
Instrumentation, so the KPIs are trustworthy
Good KPIs are automated. Great KPIs are also explainable. Build your data flows so any number on the dashboard can be traced to its source within a click or two.
-
Observability and APM. Emit request counters, latency histograms and error labels with OpenTelemetry. Use Prometheus and Grafana or a managed APM to compute SLIs and percentiles. If you are new to the space, our overview on Observability, effective monitoring can help you choose a stack.
-
Real user monitoring and synthetics. Pair RUM for real browsers with synthetic probes for constant coverage. This reveals gaps during off peak hours and validates external dependencies.
-
CI or CD events. Capture deployment times and outcomes straight from the pipeline. Store normalised events to calculate deployment frequency, lead time and change failure rate per service.
-
Incident and ITSM tools. Integrate your paging, incident and ticketing systems to calculate MTTD, MTTR, time to acknowledge and first contact resolution. Keep severity and root cause taxonomies simple and consistent.
-
Cost and usage telemetry. Enforce tagging at the pipeline, not as an afterthought. Allocate shared costs and surface unit costs in product dashboards. For a practical, UK centric framework see our guide to AWS cloud cost optimisation.
-
Security and policy as code. Feed vulnerability findings, configuration compliance and policy violations into the same data warehouse as operations metrics. Track remediation work as part of the scorecard.
-
Carbon and sustainability. Where supported, ingest provider carbon footprint data by account and region and normalise to your unit metrics. Treat this like any other KPI with ownership and targets.
How to establish your KPI programme in 90 days
- Define goals and tiers, map services by criticality and set the small set of outcomes to improve this quarter.
- Choose a minimal KPI set, pick two to three per outcome and define each precisely with formulas and scopes.
- Wire the data, connect observability, CI or CD, incident, billing and security sources into a single store.
- Build the first scorecard, start with service level views that roll up to a concise executive summary.
- Set policy targets, agree SLOs, remediation windows and cost allocation thresholds with stakeholders.
- Create runbooks and alerts, page on burn rate and critical regressions, ticket on everything else.
- Review weekly, run a 30 minute KPI review per team and one monthly cross functional session.
- Improve continuously, retire any KPI that fails to drive decisions and add new ones sparingly.
A short, disciplined loop beats a perfect but slow rollout. We often start with one strategic product or platform area and expand.
Common pitfalls to avoid
Vanity metrics. Request counts, CPU graphs and ticket volume tell you little about outcomes. Elevate measures that tie to user experience, speed, cost and risk.
Averages instead of percentiles. Mean latency hides tail pain. Report p95 and p99 so long running calls are visible.
Chasing 100 percent. Perfect availability is not only impossible, it creates perverse incentives. SLOs and error budgets provide the right balance between stability and change.
Measuring what is easy. If a metric cannot be tied to a specific decision or behaviour, remove it from the scorecard.
Ignoring ownership. Every KPI needs a named owner who can influence it and a clear escalation path when it drifts.
Skills and culture make KPIs work
Numbers change behaviour only when teams have the skills and support to act. Budget for ongoing training in SRE, observability, FinOps and secure delivery, and give engineers protected time to reduce toil and improve reliability. If you are building a learning plan for 2025, consider structured upskilling programmes that combine live mentoring with curated online content, for example the LinkedIn Learning aligned offering from Academia Europea UpSkilling.
How Tasrie IT Services can help
Tasrie IT Services specialises in DevOps, cloud native and automation, with senior engineers who have implemented KPI driven operations across start ups and enterprises. We help teams to
- Design outcome aligned KPI frameworks anchored in SLOs and unit economics.
- Instrument services with OpenTelemetry, robust CI or CD and policy as code.
- Build observability, cost and security dashboards that executives and engineers both trust.
- Automate responses, from cost controls to runbook execution and progressive delivery.
If you are modernising your platform or establishing managed operations, our practical guides on cloud engineering best practices, cloud native fundamentals and what to expect from managed IT services in 2025 provide useful next steps. When you are ready to adopt an SLO and KPI driven model, we can partner with your team to implement it and measure the gains. The result is faster delivery, higher reliability and lower, more predictable cost.
Further reading
- DORA metrics and research on delivery performance, see the official DORA research.
- SLI and SLO design patterns from the Google SRE workbook.
- The FinOps Framework for aligning cloud spend with business value.
Finally, remember that KPIs are a product, not a project. Iterate with the same rigour you apply to software. Retire metrics that do not drive decisions, and double down on the ones that do. The payoff is a cloud platform that is measurably reliable, fast, secure and cost effective.